
Basic Concepts
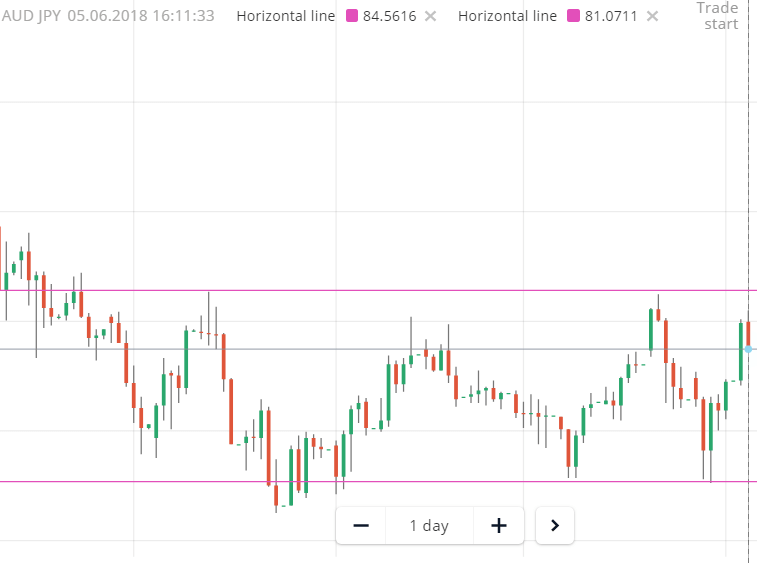
One of the basic concepts of technical analysis is the trend. Today, Olymp Trade’s Analysts will tell you all about these prices’ oscillations that are essential for traders to get the opportunity to make profitable deals. Sometimes, it is very easy to visualize and to identify the overall direction of a given asset. In the image we can clear see one of the first type of trend. Which is the uptrend or bullish trend. Whereby it is characterized by rising prices for new highs and higher local minimums.

However, there are occasions where prices’ movements are not so clear. In this technical analysis, a sideway/flat trend appears. It is characterized by horizontal trend lines that obstruct the asset’s volatility to a restricted trading range. Take a look at the image that shows how prices are inside of a trading range in the sideway trend.
In the flat trend there is a relative balance between the forces of supply and demand. It is believed that prices may stay between the limits of the range. It is limited by support and resistance lines of the trend. Until the price breakouts above resistance or breaks below support lines.
Final Point
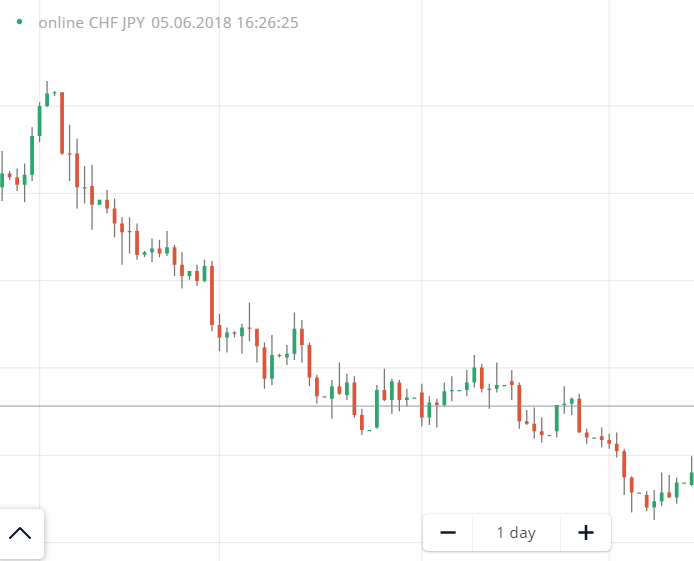
As a final point about types of trends in this technical analysis, the downtrend or bearish trend is characterized by lower prices. Especially for new low peaks and lower local minimums. As the opposite of the uptrend, the bearish trend suggests that supply is higher than demand. Thus forcing sellers to offer lower prices for the same asset. Take a look at the image of a bearish trend.
Now that our Olymp Trade’s Analysts explained the 3 types of trends, let’s talk about how you identify the trend Lengths. Beside these 3 types of trend directions, there are 3 classifications you need to pay attention. Ada it will be according to the time duration. A trend of any type can be classified as either a long-term trend, an intermediate trend or a short-term trend. Please carefully pay attention for the next two images. On the left, it is a CHFJPY chart with H4 time frame, on the right it is same currency pair with a daily chart time frame.
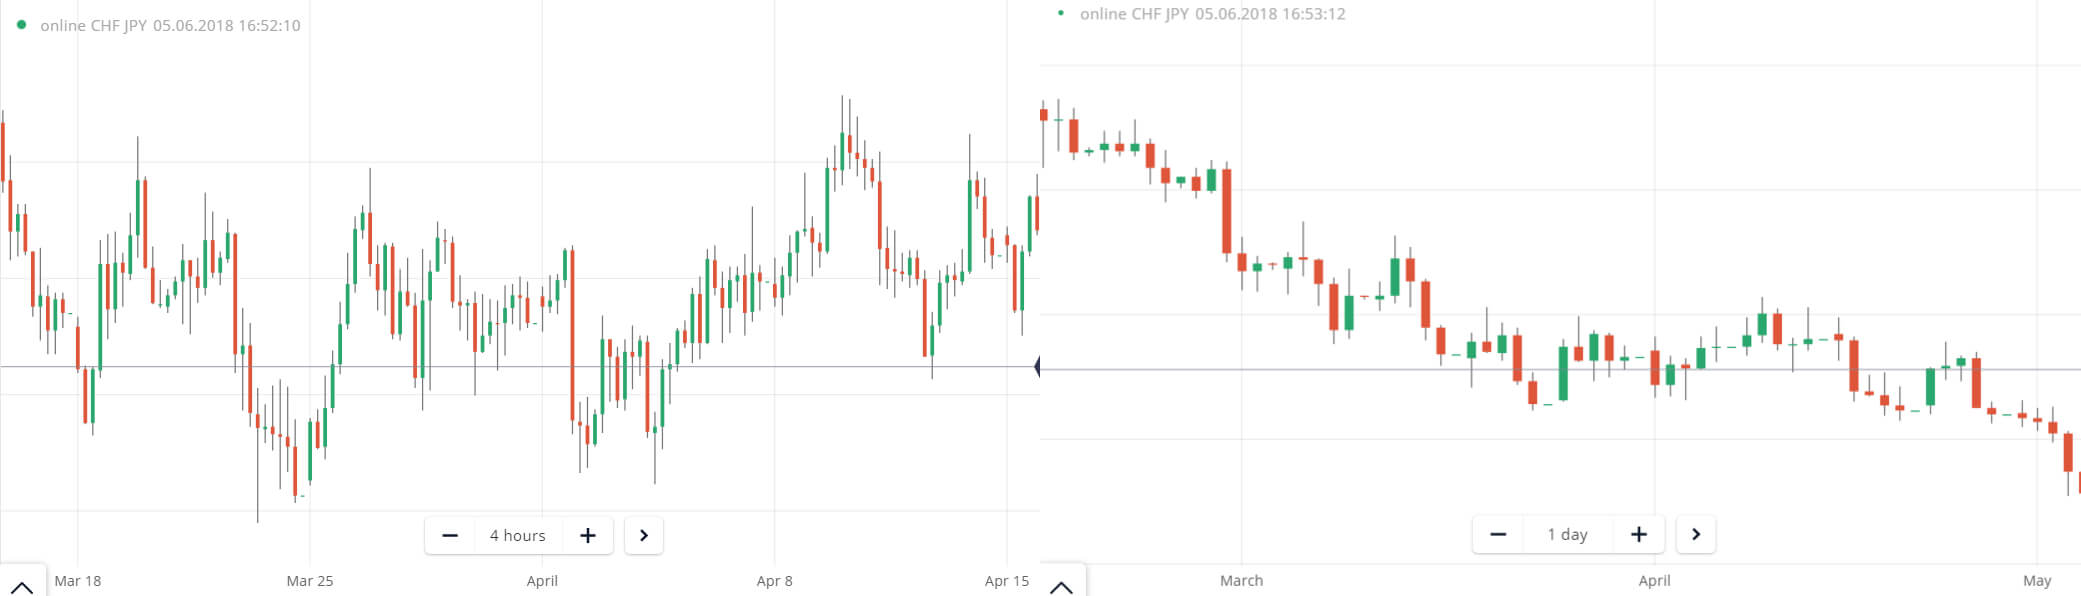
You can notice that the daily long-term trend is a bearish trend, however the H4 intermediate trend doesn’t show such strong downward movement. It is very important that you use the best chart time frame according to your trading strategy, but keep in mind that a longer time frame dominates shorter time frames.
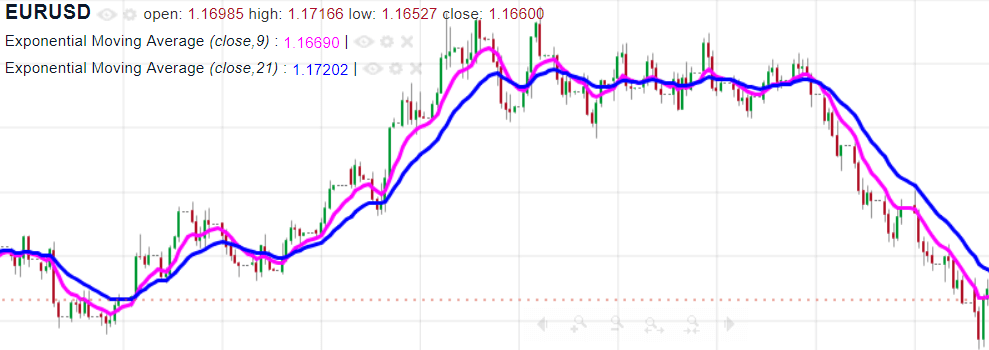
After the explanation about types and duration of trends, let’s take a look in the main indicators that can help you to identify prices’ movement. Our Olymp Trade’s Analysts selected the most common trend indicator – Moving Averages. Take a look on the next image with EMAs (9,21) plotted on the EURUSD daily chart. As you can see, the direction of EMAs represent the type of the trend.
Conclusions
The moving average crossover is the most basic type of signal to find potential trend reversal. As you could see on the picture the buy signal happened when the shorter moving average (pink line) crossed above the longer EMA (blue line). Consequently, the bearish trend started when the shorter EMA crosses below the longer moving average. Now, with the help of Olymp Trade’s Analysts you know how easy is to understand assets’ charts and how stress-free is to start making profitable trades based on the prices’ movements and trends’ reversals.


103 Responses
Strategi crossover Moving average adalah salah satu yang paling mudah. Walau bagaimanapun, seseorang perlu memahami bahawa isyarat berdasarkan persimpangan purata sentiasa terlambat. Ini bermakna bahawa mereka harus digunakan apabila terdapat kemungkinan simulator yang kuat, jika tidak, carta mungkin berubah menjadi arah yang tidak menguntungkan bagi pedagang setelah penutupan pesanan. Pengayun adalah lebih baik.
Terima kasih atas sokongan anda yang berterusan! Mulakan di akaun demo terlebih dahulu.
I use free signals on Olymp Trade. The performance is good. I plan to switch to a VIP account and receive free VIP signals that, according to reviews, are even more effective.
Terima kasih atas sokongan anda yang berterusan! Mulakan di akaun demo terlebih dahulu.
I think that free signals that provides Olymp Trade are enough for the most of traders. VIP signals can be a good adition for those, who trade volatile assets. But for me, free signals are all I need. Also checkout Olymp Trade trading platform to add the combination and use several indicators in one time. It’s may be hard to start on real account, so its good to try on demo account.
Pesanan hendaklah dibuat hanya mengikut trend pada jangka masa yang panjang. Ini adalah peraturan yang sangat penting. Kadang-kadang anda membuat kesilapan ke arah (saya bekerja pada carta 10 minit) dan tunggu pembalikan, tetapi lebih baik tidak menunggu, tetapi untuk menonton trend pada jangka masa yang lebih tinggi dan menutup pesanan awal jika arahan itu salah
Terima kasih atas pandangan yang diberikan.
Sila hubungi Khidmat Pelanggan Olymp Trade jika anda mempunyai sebarang pertanyaan.
How old do I have to be to trade Digital Options trades?
Trading di Digital Options sangat berisiko tinggi. Sebelum anda dibenarkan untuk memulakan trading di sini, anda sepatutnya telah mencapai umur 18 tahun, jika tidak Olymp Trade tidak akan membolehkan anda mendaftar dan mula berdagang di laman web mereka sehingga anda berumur sekurang-kurangnya 18 tahun.
Olymp Trade adalah syarikat yang sangat inovatif. Mereka mencipta banyak petunjuk yang membantu dalam menjalankan analisis teknikal yang paling tepat. Mereka kerap mengadakan pertandingan untuk pedagang platform terbaik, dengan itu dapat memotivasi pengguna mereka dan menanam kegembiraan untuk berdagang di dalamnya. Saya baru-baru ini turut menyertai kejohanan yang sama. Tetapi kerana saya masih bukan seorang profesional, saya berada di akhir senarai. Tetapi terima kasih atas motivasi 🙂
Terima kasih atas sokongan anda yang berterusan! Mulakan di akaun demo terlebih dahulu.
What are option trading hours?
Saya lulus latihan percuma Olymp Trade mengenai strategi dagangan sejagat. Semuanya mudah dan jelas. Tiada maklumat yang tidak perlu. Saya tidak benar-benar mula berdagang di sini kerana saya hanya berlatih di akaun demo. Tetapi saya akan membuka akaun sebenar tidak lama lagi dan perdagangan pada isyarat dengan memeriksa semula secara manual. Anda tidak boleh melakukannya tanpa ini.
Kami sarankan anggota baru kami untuk mengikuti kursus berikut sebagai permulaan: https://plus.olymptrade.com/ms/help/section/education
Mulakan di akaun demo untuk membiasakan diri dengan indikator dan strategi
Can I open a demo trading account?
Anda memang digalakkan untuk bermula di akaun demo terlebih dulu.
Anda dapat menggunakan akaun demo itu untuk meletakkan semua cara perdagangan bebas risiko dalam persekitaran yang sebenar namun semua keuntungan dan kerugian tidak akan diambil kira kerana ia adalah demo !
Kenapa platform yang dipercayai dan terbukti tidak mempunyai program bonus biasa? Tidak boleh tetapi bersetuju bahawa Olymp Trade boleh dipercayai dan jujur dengan penggunanya. Tetapi bonus hanya boleh digunakan apabila wang sebenar hilang. Apabila saya mendeposit 1,000 dolar, saya fikir sekarang saya akan mula berdagang dengan 1,300 dolar, tetapi tidak.
Terima kasih kerana telah memilih Olymp Trade sebagai platform dagangan anda.
OlympTrade dicadangkan kepada saya oleh seorang kawan lama saya yang saya temui ketika hadir kursus perdagangan. Saya gembira dengan segala-galanya buat masa sekarang. Saya tidak mempunyai sebarang aduan mengenai apa-apa.
Terima kasih kerana telah memilih Olymp Trade sebagai platform perdagangan anda.
Stop-outs is an innovation of the Olymp Trade investment platform. They had saved me from big losses dozens of times. The stop-out automatically closes the order after it’s opened, If the value of the asset begins to fall and reaches the purchase price. I often open orders in the open state and go to sleep. If anything happens, the stop out will work and I will get to 0 maximum
Terima kasih atas sokongan anda!
Kami menyarankan anggota kami untuk mengikuti kursus berikut sebagai permulaan: https://plus.olymptrade.com/ms/help/section/education
Mulakan di akaun demo untuk membiasakan diri dengan indikator dan strategi
How many positions should be open simultaneously?
Ada yang mengatakan anda tidak boleh membuka lebih daripada enam hingga OP secara serentak kerana ianya akan menjadi terlalu sukar untuk dikendalikan dengan betul. Cuba ambil sekurang-kurangnya tiga atau empat OP pada satu masa. Anda boleh menjangkakan satu daripada empat dagangan akan gagal, jadi dengan tiga atau empat OP anda boleh jangkakan ianya berjaya. Jadi anda tidak akan meletakkan terlalu banyak tekanan psikologi pada diri sendiri.
How do I choose a strike price when buying an option ?
Satu cara adalah dgn memasukka strike price ke dalam position simulator untuk melihat bagaimana ianya boleh bertindak balas.Walau bagaimanapun OT masih belum menawarkan servis yang sebegitu.
Saya berdagang di Olymp Trade kerana anda tidak memerlukan berjuta-juta pelaburan untuk memulakan perdagangan. Saya tidak mempunyai banyak wang dan semua yang saya dapat simpan dari gaji adalah maksimum 200-300 dolar. Anda boleh meningkatkan modal yang baik dengan pelaburan bulanan seperti ini di sini. Pulangannya ialah 20% daripada saham syarikat Amerika setahun. Saya melabur dalam aset dengan selamat dan tanpa risiko.
Terima kasih kerana telah memilih Olymp Trade sebagai platform trading anda.
Are Digital Options trading platform in Olymp Trade complicated to use?
Anda akan mendapati platform Olymp Trade telah dibuat dengan semudah yang mungkin. Anda juga boleh mendaftar dan mula menggunakannya platform ini di akaun demo sebelum anda meletakkan apa2 deposit pada broker ini. Gunakan akaun demo ini sebaik dan sepuasnya supaya anda berasa yakin apabila memulakan trading di akaun sebenar nanti.
There is a large Olymp Trade Facebook community and a YouTube channel. They publish new information, notify about the holding of tournaments and give traders the opportunity to talk to each other in both resources. I’ve found a company of people on Facebook who added me to the messenger group and they constantly share their successes and trading recommendations there.
Kadang-kadang anda perlu berhati-hati dengan group atau komuniti yang anda sertai. Ada diantara mereka scammer yang bersedia untuk menipu wang anda.
How long do bonuses take to get credited?
Biasanya sebaik sahaja anda membuat deposit yang melayakkan anda untuk mendapat bonus , bonus tersebut akan ditambahkan ke akaun anda pada masa itu juga.
How can I spot profitable trades to place?
Satu-satunya cara yang akan membuatkan anda benar-benar menguasai trading adalah melalui pengalaman. Dengan itu, anda harus sentiasa mengetahui apa-apa tentang berita dan terus mengikuti semua berita dan berita kewangan semasa, dan juga bersedia untuk bertindak dengan serta-merta sebaik sahaja anda melihat satu trading yang menguntungkan
The article made an awesome point that at some timeframes trend type may be different from the one on the other timeframe. This is something I really like about Olymp educational articles and videos. They never say something like “buy when the price is moving up”. You must have a closer look at different aspects of the chart and asset behavior. Cross-timeframe analysis can give you a good idea on what is really going on, so that you can make better short-term decisions and make more money consequently.
If there was one advice I could give Olymp Trade investors that would be: open trades ONLY in trends direction. There is lot more to add here, and some of the principles are described in the above article, but still, trend is your friend for sure. It doesn’t matter whether you trade options or forex. I trade both at Olymp and it works either way.
I absolutely hate these situations when sideway movement starts. First of all I find it difficult to identify when it has started and keep thinking there is still up or downtrend on the market. Secondly I’m very impatient. I know its better to stay out of trading options at Olymp trade when flat movements take place. But I can’t wait and still buy some options. Hope your article will help me remember how important that is to distinguish between strong directional trend and flat. Thanks for trying at least ))
Everything sounds very easy and simple in words, and I learned quickly theory from the Olymp Trade blogs. A trend is a vector indicating the market dynamics direction. It consists, as you already know, of individual waves: rising and falling, which in turn form peaks and troughs. You can observe three types of trends: upward, downward, and horizontal. But in reality it means that without proper practice you aren’t able to use all these trends correctly and make a lot of mistakes in your calculations, which leads to the money loss. The only thing that helps me is that I often use the Olymp Trade Demo account, which I often update.
Saya tahu forex Olymp Trade tawarkan banyak indikator untuk analisis teknikal tapi saya tak rasa ianya boleh betul-betul berhasil dan berikan anda keuntungan yang banyak. Saya tak maksudkan anda tak boleh jana pendapatan dengan analisis teknikal tapi jika anda ingin maksimakan keuntungan, anda perlu bergerak ke hadapan dan aplikasikan analisis asas. Saya tahu pedagang profesional tidak hanya gunakan indikator tapi selalu cari berita dan belajar psikologi pedagang untuk jangkakan pergerakan pasaran. Walaupun Olymp Trade ada program pembelajaran yang maju, untuk pelajari analisis asas anda perlu belajar sendiri dan dapatkan banyak pengalaman. Saya percaya, itu satu-satunya cara untuk menjadi pedagang yang sangat baik.
Bagi saya, sebab utama untuk pilih Olymp Trade adalah platform perdagangannya. Saya tak mahu bincangkan platform perdagangan lain tapi Olymp (pada pendapat saya) ada platform perdagangan terbaik di pasaran. Perdagangan adalah natif dan walaupun anda bukan seorang pedagang berpengalaman, ianya tidak sukar untuk dipelajari. Secara peribadinya, saya mengambil masa selama seminggu untuk menonton webinar dan biasakan diri dengan Olymp Trade Forex tapi anda perlu ada keinginan untuk menjadi pedagang dan minat dalam bidang ini.
One of the main tasks for a trader is to forecast the trend movement in the future. The main role in this process is played by technical market analysis. Awareness of its key features makes it possible to predict future price movement, as well as to make a forecast on the general state of the market in the future. The essence of this type of analysis is the assumption that the market has a memory and the price dynamics in the future can be determined based on all regularities of its fluctuations in the past. Traders create all their forecasts based on charts of price dynamics and change of quotes for certain periods of time.
Those traders at Olymp Trade Forex, who use such an analysis, operate with various technical indicators that are part of the trading terminal. These indicators are quite diverse, which allows everyone to create their own action plan for almost any instrument, based only on the data of a certain indicator. I prefer to be guided by videos and fresh tips in Olymp Trade platform if I don’t know what this indicator means, this really save a lot of time.
Olymp Trade is almost out of competition if we speak about education and tips. Some traders can find this excessive, but if you’re just a beginner, that’s freeway to learn trading and that’s cool that company take care not only about revenue, but also about educaitng and mastering people. I started trading Olymp trade forex demo and learned with webinars, it’s really useful. You just need to want this.
I love how technical analysis is organized on Olymp Trade Forex. It’s really easy to use and I, even without high competency quickly have learned basics of technical analysis and then turned my knowledge into real profit. Before Olymp Trade I tested a lot of other brokers and trading platform, but only in Olymp Trade technical analysis is organized really good and easy.
Everyone who has been reading olymp trade malaysia reviews for a long time knows that our company keeps an eye on all novelties, and this allows us – its customers – to be the first to know useful things that can be used in the work without any doubt.
As a rule, a day trend is really enough for you to determine the perspective for the next couple of days. Especially if you are in long-term positions at Olymp Trade. It’s very convenient…
Carta trend utama untuk pedagang semestinya adalah carta harian. Dalam kes ini, trend boleh menjadi besar dan tidak bermakna serta bergantung kepada jeda masa dan rangka masa yang dipilih pada carta. Biasanya, carta mingguan atau carta bulanan akan digunakan untuk menentukan trend jangka masa panjang. Saya menyukai platform perdagangan Olymp Trade kerana semuanya dapat dilakukan dengan mudah dalam beberapa klik sahaja. Selain itu juga terdapat banyak penunjuk terbina dalam. Cuma pilih dan gunakannya.
Analisis teknikal merupakan peluang anda untuk menjana pendapatan setiap hari.
Ini adalah sebab anda perlu mempelajari arahan ini.
Saya menyukainya kerana terdapat banyak bahagian dalam bidang ini, dan antaranya anda pasti boleh menjumpai sesuatu yang akan membolehkan anda untuk bekerja dengan efektif. Perkara utama bukannya untuk mengambil risiko dan cuba periksa serta menguji semua perkara. Tindakan Olymp Trade yang sentiasa mengingatkan pelanggannya tentang perkara tersebut bukanlah sesuatu yang sia-sia.
Saya tidak memahami cara menggunakan garis trend, bolehkah sesiapa menerangkannya kepada saya?
Garisan trend dilukis pada dua minimum atau maksimum harga pada carta. Tambahkannya pada pemilihan penunjuk Olymp Trade dan gunakannya untuk menentukan trend. Jika anda nampak pecahan dalam garisan trend, anda harus menutup kedudukan tepat pada masanya atau jangan membuka langsung. Sebenarnya, saya pasti anda boleh mendapatkan maklumat ini dalam bahan pendidikan Olymp Trade. Biasanya, ia tidak susah untuk berdagang dengan broker ini, saya tidak pernah ada apa-apa masalah dengannya.
Apakah alat analisis teknikal atau konsep lain yang ditawarkan oleh Olymp Trade? Kerana ulasan olymp trade ini hanya menyebut tentang trend, tetapi saya berminat untuk tahu tentang yang lain juga.
Untuk berjaya di olymp trade forex, sangat penting untuk anda memahami corak pasaran dan belajar menganalisis semua peristiwa di semua tahap. Saya suka bahawa syarikat ini bukan sahaja memberikan capaian kepada perkhidmatan tertentu, malah juga memberikan arahan yang tepat kepada pelanggan supaya anda boleh terus menggunakan ia dengan betul.
Pada pendapat saya, inilah penjagaan pelanggan yang sebenar!
Adakah anda boleh mengeluarkan wang dengan cepat daripada syarikat ini???
Lazimnya Olymp membayar wang dalam masa sehari.
Masa menunggu yang maksimum dalam situasi saya ialah kira-kira 3 hari sebelum cuti Krismas.
Analisis teknikal ialah komponen penting dalam kerja pedagang. Ia sesuatu yang membolehkan anda bekerja pada bila-bila masa, meskipun tiada berita atau peristiwa yang baik dalam pasaran hari ini. Dan terdapat banyak ulasan olymp trade malaysia yang menjadi bukti kepada hal ini kerana analisis teknikal ialah perkara yang betul-betul membantu kita mengenal pasti tahap dan titik masuk pasaran yang optimum, tanpa mengira apa jua aset yang anda gunakan dalam kerja anda. Tambahan lagi, terdapat kepelbagaian yang banyak yang membolehkan semua orang menemui format yang boleh digunakan oleh mereka dalam kerja mereka. Hal ini penting kerana kita tidak boleh menggunakan format dan strategi yang sama. Kita semua adalah berbeza dan berkelakuan berbeza. Hanya usaha mencari dan sikap kritikal terhadap perkara yang anda tunjukkan dalam kerja yang boleh menyumbang kepada kejayaan. Anda perlu sedar tentang hal ini dan terus berusaha seolah-olah anda belum mencapai matlamat anda, biarpun anda telah mendapat lebih daripada yang dijangkakan.
Seorang pedagang mewakili perniagaan moden. Hal ini bermaksud seorang pedagang bertanggungjawab ke atas setiap keputusannya.
Walaupun ini bukan kali pertama anda membaca ulasan Olymp Trade Malaysia, anda masih mengalami perasaan positif setiap kali.
Kadang-kadang perkara yang paling ringkas betul-betul boleh membantu anda sekarang. Jadi saya mencadangkan semua orang supaya mengambil sedikit masa untuk berbuat demikian.
Saya kaji Olymp Trade dengan teliti kerana sentiasa ada pemerhatian yang menarik atau butiran yang boleh anda cuba gunakan esok. Selain itu, ia boleh diuji dan dilaraskan dengan akaun demo. Ini sangat penting, pasaran kan sentiasa berubah dan kita perlu tahu perkembangan terkini.
Pernah awak berdagang ikut webinar Olymp Trade?
Ada hasilkan untung tak?
Saya pernah menggunakan strategi perdagangan berdasarkan purata bergerak mengikut webinar Olymp Trade. Sangat mudah untuk memahami teknik ini kerana penganjur webinar menerangkannya secara terperinci dan menunjukkan beberapa contoh entri yang menguntungkan. Pengalaman saya positif kerana saya mengulangi semua perkara di akaun dagangan saya. Sekarang saya mengkaji strategi lain berdasarkan analisis teknikal.
Saya yakin yg ulasan Olymp trade malaysia adalah seperti arahan untuk saya, yang bantu saya memahami banyak butiran tentang analisis teknikal.
Kerana setiap penunjuk dan alat mempunyai sifat tersendiri, jadi ia mengambil sedikit masa dan pengalaman untuk melihat hasilnya.
Jadi bacalah ulasan Olymp trade – berkesan.
Siapa tahu apa syarat untuk spread Olymp Trade Forex??
Olymp Trade tidak mengenakan bayaran untuk spread, hanya ada komisen.
Kepada penulis artikel ini, kamu terbaik! Ya, awak betul, analisis forex dan analisis teknikal Olymp Trade berdasarkan penggunaan penunjuk atau alat perisian khas yang dicipta berdasarkan algoritma, dengan mengambil kira kaedah peramalan statistik .
Saya ingin menambah beberapa perkara penting: anda tidak dapat membentuk satu set petunjuk untuk analisis yang berfungsi mengikut prinsip yang sama atau serupa. Untuk melakukan analisis teknikal berkualiti tinggi, anda perlu menggunakan pelbagai jenis indikator, termasuk penunjuk volum, garis trend, pengayun.
Peraturan asas analisis teknikal kedua di Olymp Trade adalah bahawa ketika melakukan transaksi perdagangan dalam jangka waktu tertentu, anda perlu melihat carta dengan jangka waktu yang lebih pendek. Semoga untung banyak, rakan sekerja!
Saya dapat tahu tentang kebolehan analisis teknikal syarikat broker ini daripada ulasan olymp trade malaysia.
Sebenarnya agak sukar pada mulanya, kerana saya dibebankan dengan pelbagai maklumat. Saya tak tahu apa untuk digunakan dan sebaliknya. Dan saya ambil masa untuk tahu apa yang patut digunakan. Kerana kita buat semua percubaan dengan wang. Tetapi saya gembira kerana mendapat sokongan profesional yang bersama saya pada setiap peringkat. Mereka membimbing saya tentang cara memperuntukkan modal dan bagaimana cara menggunakan alat tertentu, kerana ini sangat penting, setiap perkara ada maklumat terperinci.
Saya masih baca ulasan olymp trade, kerana ia sentiasa mengandungi maklumat berguna. Dan ini pasti sangat bernilai kepada saya.
olymptrade ada tawarkan lebih banyak penunjuk daripada yang dinyatakan dalam artikel ini?
Mengenalpasti trend ialah salah satu langkah paling penting dalam analisis teknikal. Ini juga penting untuk memahami bahawa pembetulan adalah bagus untuk trend. Tanpa penjejakan semula, trend tidak dapat dikekalkan. Pemulihan juga memberi peluang untuk memasuki pasaran untuk mengikut trend. Berhadapan dengan tindakan harga yang kuat adalah berbahaya.
Konsep trend ialah asas perdagangan dan baguslah olymp trade menumpukan salah satu artikel untuknya.
Secara asas, perdagangan mengikut trend ialah teknik paling luas yang digunakan ramai pedagang di seluruh dunia, saya gembira untuk lihat juruanalisis olymp trade menyediakan pedagang dengan maklumat tentang perdagangan trend. Pada pendapat saya, ia adalah cara paling efektif untuk belajar mekanisme pasaran dan menghasilkan asas untuk kandungan pendidikan lanjut seperti penunjuk/corak/angka dan sebagainya. Oleh itu, berguna juga kebolehan untuk menentukan pergerakan trend.
Apa beberapa prinsip untuk menentukan trend? Bagaimana untuk tentukan pembalikan trend untuk meramal pergerakan lanjut?
Untuk menentukan pembalikan trend, tahap sokongan dan rintangan digunakan, begitu juga penunjuk RSI, Williams aligator dan parabolik.
Jika pedagang memahami analisis teknikal, maka ia tidak sukar untuk mencari pergerakan trend.
Itu adalah artikel yang sangat berguna untuk pedagang baharu dan pakar olymp trade melakukan kerja yang bagus dengan menerangkan keunikan fundamental analisis carta. Mestilah setiap pedagang yang ingin berjaya di pasaran perlu mahir dalam menganalisa trend kerana trend yang membawa keuntungan. Purata bergerak adalah salah satu penunjuk yang paling mudah dan paling efektif yang digunakan untuk analisis pasaran, jadi jika anda tidak pernah dengar tentang ‘moving average crossover’, anda perlu baca artikel ini dan gunakan pengetahuan ini semasa berdagang.
Pasaran flat adalah situasi perdagangan kegemaran saya dan saya sentiasa mencarinya di platform forex olymp trade. Ia menawarkan peluang baik untuk untung. Kamu hanya perlu beri perhatian berikutan naik turun yang berulang. Saya cadangkan Stochastic dalam pasaran flat. Ia sesuai untuk keadaan ini.
Sebelum ini saya rugi wang kerana “trend perantara”.
Sangat bagus sehingga anda menyebut apa yang dipanggil “trend perantara” dalam artikel. Saya masih ingat bahawa sebelum ini saya tidak banyak memberi perhatian kepada trend sedemikian. Saya fikir saya tepat pada masanya melihat arah aliran utama pada jangka masa yang lebih tinggi, membuka arah aliran sepadan yang saya ingat akan berwarna hijau tidak lama lagi dan kemudian selepas beberapa ketika saya kehilangan wang. Ia berlaku kerana sebelum mengikut laluan yang dijangkakan, harga menghantar “ciuman” terakhirnya kepada pedagang dengan menendang keluar hentian mereka, haha. Satu tindakan yang murah hati! Saya sering memikirkannya dan kini saya sedar bahawa ia patut berlaku kerana sesuatu harus mengajar kita untuk sentiasa berjaga-jaga semasa berdagang kerana ia adalah satu usaha yang serius. Sekarang saya sedar, ambil mudah dan ambil semua langkah berjaga-jaga yang perlu, tetapi sebelum ini ia adalah misteri bagi saya. Saya menyedari semuanya lebih awal daripada saya menyertai platform forex perdagangan olymp.
Bagaimana untuk mengawal risiko dengan Olymp Trade? Perkhidmatan apa?
1. Demo.
2. Leveraj
3. Maklumat pasaran
Perkara utama yang anda perlu ingat tentang risiko.
Alat pengurusan risiko yang mudah seperti take-profit dan stop-loss memudahkan urus niaga dan membantu mengurangkan kerugian. Anda boleh mengubah arahan henti dan parameter ambil keuntungan pada bila-bila masa, walaupun semasa pesanan masih terbuka.
Tetapkan Stop Loss secara automatik (dalam tetapan profil, anda boleh lumpuhkan fungsi ini dan tetapkan Stop Loss secara manual) – kerugian tidak akan melebihi jumlah pesanan.
Analisis teknikal adalah salah satu perkara paling ketara dalam perdagangan. Walaupun terdapat banyak perbincangan tentang yang mana lebih bagus: analisis teknikal atau fundamental, saya rasa tak mungkin untuk berdagang tanpa analisis teknikal yang betul. Trend adalah konsep utama analisis teknikal sebab itu sangat bagus untuk menjumpai artikel yang ditulis oleh pakar olymp trade tentang segala maklumat asas. Baguslah platform perdagangan olymp trade menawarkan semua alat yang diperlukan untuk menjejak trend dan menjadikannya jelas dan komprehensif.
Saya suka baca artikel ini. Menggunakan purata bergerak dalam perdagangan anda pasti memberikan maklumat tertentu tentang pergerakan pasaran di masa depan, tetapi ia masih tidak kukuh jika digunakan bersendirian. Platform perdagangan Olymp Trade membenarkan pedagang untuk menggunakan beberapa penunjuk dan pengayun pada satu masa bersama dengan alatan grafik. Saya yakin bahawa penunjuk terbaik dalam perdagangan adalah tindakan harga. Kerana itu saya amat mengesyorkan anda jangan terburu-buru dengan penunjuk supaya mengelakkan kekeliruan. Satu-satunya penunjuk yang tepat dan boleh dipercayai dalam perdagangan adalah harga.
Broker Olymp Trade mempunyai dua mod perdagangan: forex biasa dan FTT. Saya pasti kedua-dua ini anda perlu belajar mengenal pasti trend dan menggunakan pengurusan risiko.
Saya bergantung pada analisis teknikal. Sebelum ini saya cuba bergantung pada analisis asas tetapi ia menjadi jelas bahawa analisis teknikal adalah lebih bagus. Ia berfungsi dalam kebanyakan kes.
Dua jenis analisis ini digunakan oleh pelbagai jenis klien – pedagang dan pelabur.
Analisis fundamental adalah hebat dan mungkin digunakan oleh scalper juga, lol. Begitu juga pelabur boleh melukis garisan trend, menyelesaikan corak dan menggunakan penunjuk. Olymp Trade membuka pintu untuk semua.
Nampaknya mana-mana ulasan Olymp Trade semuanya berkaitan dengan analisis teknikal. Haha
Saya ingat lagi apabila saya hasilkan keuntungan melalui perdagangan garisan trend. Ini adalah ASAS perdagangan. Kenapa perlu ratusan alat, carta, instrumen jika kita tak tahu tentang trend? Tak masuk akal. Kita tak perlu tahu teori advance untuk hasilkan keuntungan seperti itu. Bagaimana kita dapat memahami pergerakan trend? Mudah saja!x
Analisis teknikal dan fundamental adalah segala yang kita perlukan. Itu betul! Tanpa salah satu komponen ini anda mungkin melihat pergerakan harga yang lebih rendah.
Sebagai pedagang kita memperdagangkan nilai ramalan matematik. harga berubah kerana pelbagai aspek seperti geopolitik, ramalan ekonomi kewangan, aspek budaya atau teknologi.
Trend mungkin tempatan atau global. strategi perdagangan berbeza membolehkan kita menghasilkan keuntungan untuk intrahari atau jangka panjang dengan menggunakan trend sebagai penunjuk.
Saya boleh faham. Saya juga mula dengan dagangan garis di platform olymp trade. Sudah tentu mod forex, saya percaya pedagang harus bermula dari perdagangan forex. Hanya selepas mendapat pengalaman tertentu mereka boleh pertimbangkan aset lain. Forex adalah aktiviti yang berisiko, terdapat aset lain yang risiko dikurangkan, seperti bon contohnya. Saya anggap bon boleh ditambah ke portfolio untuk mencapai keseimbangan risiko/ganjaran.
olymp trade menawarkan bitcoin sebagai kaedah pembayaran?
Ya, mereka ada pilihan itu juga. Saya gunakan Binance Pay. Jadi saya rasa awak boleh temui kaedah yang sesuai untuk awak juga.
Olymp Trade tidak akan biarkan anda terlepas mana-mana perkara penting tentang perdagangan, anda pasti tahu perkara ini pada tahap asas dan disebabkan asas ini, anda boleh mula berdagang dalam pasaran. Anda hanya perlu prihatin dan memantau perkembangan berterusan…
Terima kasih untuk artikel tentang analisis teknikal, saya telah mengkaji broker ini selama sebulan, cara berdagang dengan betul. Saya dijemput oleh rakan, yang berdagang ribuan dolar. Dia kata ini paling boleh dipercayai dan tiada masalah semasa mengeluarkan jumlah besar.
Saya percaya kawanku, jadi saya pun berdaftar. Dan minggu lalu saya cuba akaun demo broker ini dan saya suka sangat. Minggu depan saya akan buat deposit $1,000 untuk uji dan gunakan sistem saya untuk berdagang. Jika saya dapat untung, saya akan keluarkan serta merta. Pengeluaran keuntungan ialah ciri utama untuk diperiksa di broker.
Saya juga perasan terdapat banyak maklumat dalam artikel olymp trade. Untuk saya agak berguna, terutamanya zaman sekarang. Pasaran tidak dapat diramal dan semakin sukar untuk menganalisa.
Apa pun, dengan alat yang disediakan oleh syarikat ini, segalanya mungkin.
Penunjuk purata bergerak banyak membantu saya. Jujur kata, ini salah satu penunjuk pertama saya dan sejak itu saya menggunakannya dalam strategi saya. Terima kasih kepada olymp trade kerana menyediakan peluang menghasilkan wang seperti ini. Ia agak sukar untuk saya sebelum ini.
Korang rasa yang gaya perdagangan yang mana paling menguntungkan? Menggunakan penunjuk atau berdasarkan analisis teknikal?
Menggunakan penunjuk adalah sebahagian daripada keseluruhan analisis teknikal juga. Analisis Teknikal boleh menjadi kaedah dagangan yang menguntungkan dan sekiranya anda mempunyai pengalaman dan masa yang cukup. Tetapi saya juga menyarankan pembelajaran dan menggunakan analisis asas untuk menyokong kecenderungan anda. Dengan cara ini, anda boleh menggunakan analisis asas untuk mengetahui apa yang patut dibeli, dan menggunakan analisis teknikal untuk mengetahui bila untuk membeli dan menjual aset.
Persilangan purata bergerak membantu saya beberapa kali sebelum ini.
Disebabkan penunjuk ini, saya dapat menutup aras dan membuka aras baru dalam arah yang bertentangan. Bukan 100% penunjuk ini dapat membantu menentukan pembalikan trend, tapi lebih baik untuk cuba jika awak melihat gambar yang sama pada graf.
Saya sendiri percaya lebih baik cuba daripada kesal di masa hadapan.
Broker ini, secara biasa, menyiarkan kandungan yang berharga. Artikel ini agak membantu dan ini hakikatnya.
Analisis teknikal adalah lebih rumit berbanding yang dijangka. Ia tidak boleh dikecilkan kepada hanya persilangan di antara dua purata bergerak. Selain itu, analisis teknikal sahaja tidak cukup untuk mendapat keuntungan dalam berdagang. Ya, dalam banyak situasi, sudah cukup untuk berdagang menggunakan analisis teknikal, terutamanya jika anda memilih aset yang tidak terlalu bergantung kepada asas. Namun, kemungkinan besar aset tersebut mempunyai kecairan yang rendah dan menjadikannya tidak begitu menguntungkan.
Ini tidak bermakna bahawa anda perlu memantaunya sepanjang masa, melihat semua berita yang terbaru. Anda tidak perlu melakukan ini. Anda hanya perlu memahami situasi umum pada carta yang anda dagangkan, berapa hampir tahap harga penting dan mengikuti kalendar ekonomi supaya anda tidak terlepas sebarang siaran berita penting. Lakukan perkara ini dengan mana-mana broker, termasuk Olymp.
Selain itu, analisis teknikal memerlukan disiplin. Ada kalanya kita teringin untuk membuka dagangan apabila isyarat tidak begitu jelas. Dan ini boleh membawa kepada kerugian.
Sebenarnya, berdagang mengikut trend adalah salah satu cara paling terkenal untuk membuka kedudukan.
Saya rasa yang ia perkara pertama yang dipelajari oleh seseorang pedagang baru. Dan tidak mengapa. Jika anda tidak memahami cara berdagang mengikut trend, maka lebih baik untuk anda memahaminya terlebih dahulu, kerana jika tidak ia akan menjadi lebih sukar.
Apa yang saya suka tentang platform ini yang membezakan ekosistem dari yang lain adalah reka bentuk. Mereka menawarkan pengalaman seperti main game pada tahap seterusnya.
Perdagangan trend adalah kegemaran saya! Dulu saya latih diri untuk berdagang dalam arah trend lebih besar. Jadi jika D1 atau W adalah bearis contohnya,maka saya tidak membuka kedudukan panjang langsung. Walaupun jika rangka masa pendek: M15 atau M30, kerana ia terlalu bahaya dan berisiko. dan mengapa ambil risiko tambahan yang tidak selari dengan perdagangan.
Adakah antaramuka lukisan carta optimum untuk melaksanakan analisis teknikal pada pasangan forex di olymp trade?
Trend adalah teras kepada definisi perdagangan forex. Ia adalah salah satu strategi perdagangan yang mudah dikuasai dan sangat menguntungkan pada masa yang sama.
Selain itu olymp trade menawarkan pelbagai penunjuk trend.
Trend adalah konsep yang lama dan dihormati, tetapi anda mungkin tidak sentiasa mempunyai peluang untuk berdagang trend kerana aset tertentu tidak mengalami tarikan balik. Saya nasihatkan untuk belajar berdagang pada M5-M15.
Trend ialah sahabat kita – pernyataan ini adalah satu klasik, tetapi ia bukan seperti ini setiap kali. Apa pun, artikel bagus dengan maklumat umum yang diperlukan tentang trend, terima kasih!